
In this tutorial, you create a paginated report that acts as a newsletter. Each page displays static text, summary visuals, and detailed sample sales data.
The report groups information by territory and displays the name of the sales manager for the territory as well as detailed and summary sales information. You start with a list data region as the foundation for the free form report. Then you add a decorative panel with an image, static text with data inserted, a table to show detailed information, and optionally, pie and column charts to display summary information.
Estimated time to complete this tutorial: 20 minutes.
In this tutorial, the query contains the data values so that it does not need an external data source. This makes the query quite long. In a business environment, a query would not contain the data. This is for learning purposes only.
SELECT CAST('2009-01-05' AS date) as SalesDate, 'Lauren Johnson' as FullName,'Central' as Territory, 'Accessories' as Subcategory,'Carrying Case' as Product, CAST(16996.60 AS money) AS Sales, 68 as Quantity UNION SELECT CAST('2009-01-05' AS date) as SalesDate, 'Warren Pal' as FullName,'North' as Territory, 'Accessories' as Subcategory, 'Carrying Case' as Product, CAST(13747.25 AS money) AS Sales, 55 as Quantity UNION SELECT CAST('2009-01-05' AS date) as SalesDate, 'Fernando Ross' as FullName,'South' as Territory, 'Accessories' as Subcategory,'Carrying Case' as Product, CAST(9248.15 AS money) As Sales, 37 as Quantity UNION SELECT CAST('2009-01-05' AS date) as SalesDate, 'Lauren Johnson' as FullName,'Central' as Territory, 'Accessories' as Subcategory,'Tripod' as Product, CAST(1350.00 AS money) AS Sales, 18 as Quantity UNION SELECT CAST('2009-01-05' AS date) as SalesDate, 'Warren Pal' as FullName,'North' as Territory, 'Accessories' as Subcategory,'Tripod' as Product, CAST(1800.00 AS money) AS Sales, 24 as Quantity UNION SELECT CAST('2009-01-05' AS date) as SalesDate, 'Fernando Ross' as FullName,'South' as Territory, 'Accessories' as Subcategory,'Tripod' as Product, CAST(1125.00 AS money) AS Sales, 15 as Quantity UNION SELECT CAST('2009-01-05' AS date) as SalesDate, 'Lauren Johnson' as FullName,'Central' as Territory, 'Accessories' as Subcategory,'Lens Adapter' as Product, CAST(1147.50 AS money) AS Sales, 17 as Quantity UNION SELECT CAST('2009-01-05' AS date) as SalesDate, 'Warren Pal' as FullName,'North' as Territory, 'Accessories' as Subcategory, 'Lens Adapter' as Product, CAST(742.50 AS money) AS Sales, 11 as Quantity UNION SELECT CAST('2009-01-05' AS date) as SalesDate, 'Fernando Ross' as FullName,'South' as Territory, 'Accessories' as Subcategory,'Lens Adapter' as Product, CAST(1417.50 AS money) AS Sales, 21 as Quantity UNION SELECT CAST('2009-01-06' AS date) as SalesDate, 'Lauren Johnson' as FullName,'Central' as Territory, 'Accessories' as Subcategory, 'Carrying Case' as Product, CAST(13497.30 AS money) AS Sales, 54 as Quantity UNION SELECT CAST('2009-01-06' AS date) as SalesDate, 'Warren Pal' as FullName,'North' as Territory, 'Accessories' as Subcategory, 'Carrying Case' as Product, CAST(11997.60 AS money) AS Sales, 48 as Quantity UNION SELECT CAST('2009-01-06' AS date) as SalesDate, 'Fernando Ross' as FullName,'South' as Territory, 'Accessories' as Subcategory, 'Carrying Case' as Product, CAST(10247.95 AS money) As Sales, 41 as Quantity UNION SELECT CAST('2009-01-06' AS date) as SalesDate, 'Lauren Johnson' as FullName,'Central' as Territory, 'Accessories' as Subcategory, 'Tripod' as Product, CAST(1200.00 AS money) AS Sales, 16 as Quantity UNION SELECT CAST('2009-01-06' AS date) as SalesDate, 'Warren Pal' as FullName,'North' as Territory, 'Accessories' as Subcategory,'Tripod' as Product, CAST(2025.00 AS money) AS Sales, 27 as Quantity UNION SELECT CAST('2009-01-06' AS date) as SalesDate, 'Fernando Ross' as FullName,'South' as Territory, 'Accessories' as Subcategory,'Tripod' as Product, CAST(1425.00 AS money) AS Sales, 19 as Quantity UNION SELECT CAST('2009-01-06' AS date) as SalesDate, 'Lauren Johnson' as FullName,'Central' as Territory, 'Accessories' as Subcategory,'Lens Adapter' as Product, CAST(887.50 AS money) AS Sales, 13 as Quantity UNION SELECT CAST('2009-01-06' AS date) as SalesDate, 'Warren Pal' as FullName,'North' as Territory, 'Accessories' as Subcategory, 'Lens Adapter' as Product, CAST(607.50 AS money) AS Sales, 9 as Quantity UNION SELECT CAST('2009-01-06' AS date) as SalesDate, 'Fernando Ross' as FullName,'South' as Territory, 'Accessories' as Subcategory,'Lens Adapter' as Product, CAST(1215.00 AS money) AS Sales, 18 as Quantity UNION SELECT CAST('2009-01-05' AS date) as SalesDate, 'Lauren Johnson' as FullName,'Central' as Territory, 'Digital' as Subcategory,'Compact Digital' as Product, CAST(10191.00 AS money) AS Sales, 79 as Quantity UNION SELECT CAST('2009-01-05' AS date) as SalesDate, 'Warren Pal' as FullName,'North' as Territory, 'Digital' as Subcategory, 'Compact Digital' as Product, CAST(8772.00 AS money) AS Sales, 68 as Quantity UNION SELECT CAST('2009-01-05' AS date) as SalesDate, 'Fernando Ross' as FullName,'South' as Territory, 'Digital' as Subcategory, 'Compact Digital' as Product, CAST(10578.00 AS money) AS Sales, 82 as Quantity UNION SELECT CAST('2009-01-05' AS date) as SalesDate, 'Lauren Johnson' as FullName,'Central' as Territory,'Digital' as Subcategory, 'Slim Digital' as Product, CAST(7218.10 AS money) AS Sales, 38 as Quantity UNION SELECT CAST('2009-01-05' AS date) as SalesDate, 'Warren Pal' as FullName,'North' as Territory,'Digital' as Subcategory, 'Slim Digital' as Product, CAST(8357.80 AS money) AS Sales, 44 as Quantity UNION SELECT CAST('2009-01-05' AS date) as SalesDate, 'Fernando Ross' as FullName,'South' as Territory,'Digital' as Subcategory,'Slim Digital' as Product, CAST(9307.55 AS money) AS Sales, 49 as Quantity UNION SELECT CAST('2009-01-06' AS date) as SalesDate, 'Lauren Johnson' as FullName,'Central' as Territory, 'Digital' as Subcategory,'Compact Digital' as Product, CAST(3870.00 AS money) AS Sales, 30 as Quantity UNION SELECT CAST('2009-01-06' AS date) as SalesDate, 'Warren Pal' as FullName,'North' as Territory, 'Digital' as Subcategory,'Compact Digital' as Product, CAST(5805.00 AS money) AS Sales, 45 as Quantity UNION SELECT CAST('2009-01-06' AS date) as SalesDate, 'Fernando Ross' as FullName,'South' as Territory, 'Digital' as Subcategory, 'Compact Digital' as Product, CAST(8643.00 AS money) AS Sales, 67 as Quantity UNION SELECT CAST('2009-01-06' AS date) as SalesDate, 'Lauren Johnson' as FullName,'Central' as Territory, 'Digital' as Subcategory, 'Slim Digital' as Product, CAST(9877.40 AS money) AS Sales, 52 as Quantity UNION SELECT CAST('2009-01-06' AS date) as SalesDate, 'Warren Pal' as FullName,'North' as Territory, 'Digital' as Subcategory, 'Slim Digital' as Product, CAST(12536.70 AS money) AS Sales, 66 as Quantity UNION SELECT CAST('2009-01-06' AS date) as SalesDate, 'Fernando Ross' as FullName,'South' as Territory, 'Digital' as Subcategory, 'Slim Digital' as Product, CAST(6648.25 AS money) AS Sales, 35 as Quantity 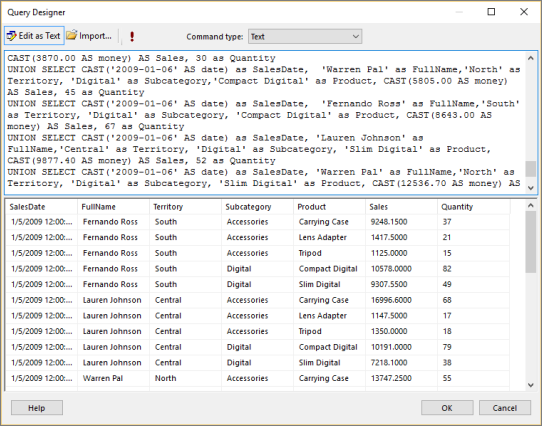
In Reporting Services, the list data region is ideal for creating free form reports. It's based on the tablix data region, as are tables and matrixes. For more information, see Create invoices and forms with lists in a paginated report (Report Builder).
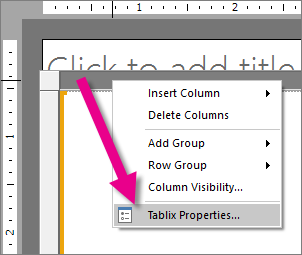
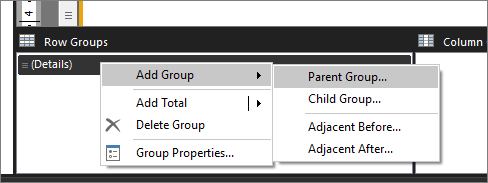
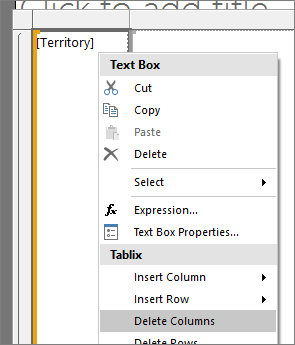
In this tutorial, you use a list to display the sales information for sales territories in a report formatted like a newsletter. The information is grouped by territory. You also add a new row group that groups data by territory, and then delete the built-in Details row group.
Note This report uses the paper size Letter (8.5 X11) and 1 inch margins. A list box taller than 9 inches or wider than 6.5 inches might generate blank pages.
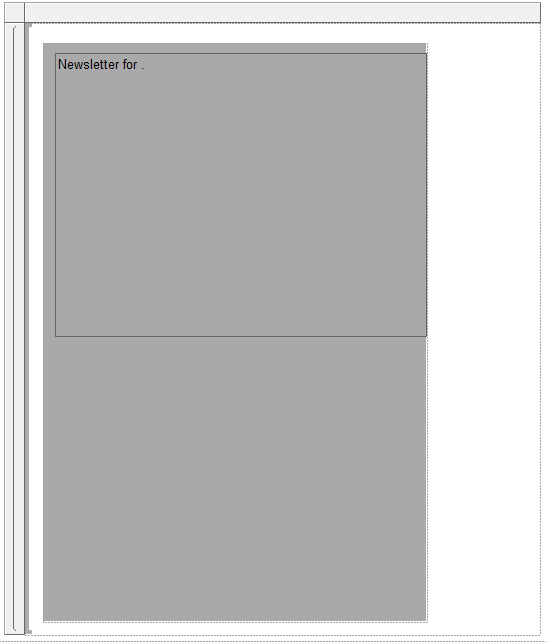
One advantage of list data regions is that you can add report items such as rectangles and text boxes anywhere, instead of being limited to a tabular layout. You can enhance the appearance of the report by adding a graphic (a rectangle filled with a color).
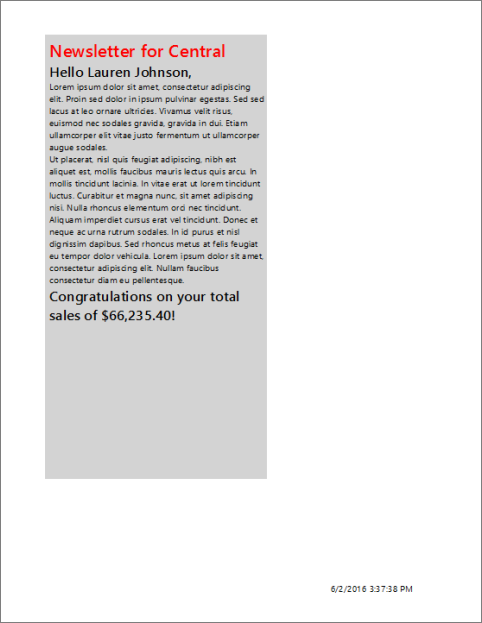
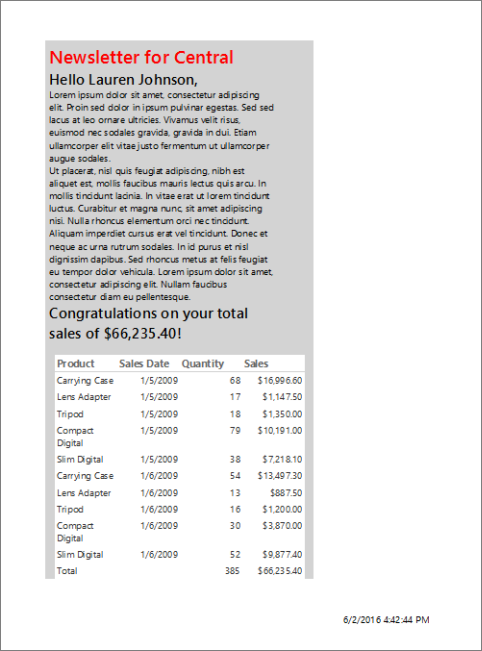
The left side of the report now has vertical graphic that consists of a light gray rectangle, as shown in the following image.
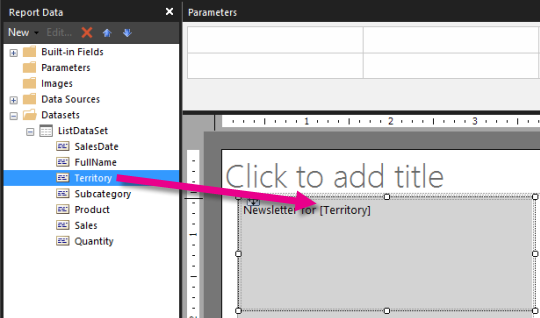
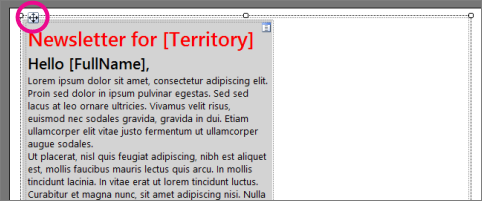
You can add text boxes to display static text that is repeated on each report page and data fields.
Lorem ipsum dolor sit amet, consectetur adipiscing elit. Proin sed dolor in ipsum pulvinar egestas. Sed sed lacus at leo ornare ultricies. Vivamus velit risus, euismod nec sodales gravida, gravida in dui. Etiam ullamcorper elit vitae justo fermentum ut ullamcorper augue sodales. Ut placerat, nisl quis feugiat adipiscing, nibh est aliquet est, mollis faucibus mauris lectus quis arcu. In mollis tincidunt lacinia. In vitae erat ut lorem tincidunt luctus. Curabitur et magna nunc, sit amet adipiscing nisi. Nulla rhoncus elementum orci nec tincidunt. Aliquam imperdiet cursus erat vel tincidunt. Donec et neque ac urna rutrum sodales. In id purus et nisl dignissim dapibus. Sed rhoncus metus at felis feugiat eu tempor dolor vehicula. Lorem ipsum dolor sit amet, consectetur adipiscing elit. Nullam faucibus consectetur diam eu pellentesque. =Sum(Fields!Sales.value)
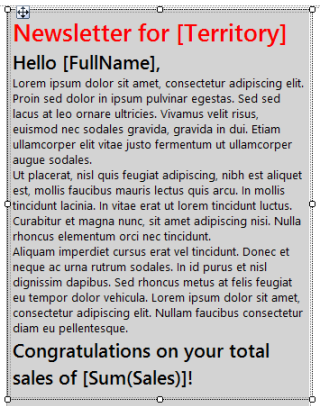
The report displays static text and each report page includes data that pertains to a territory. Sales are formatted as currency.
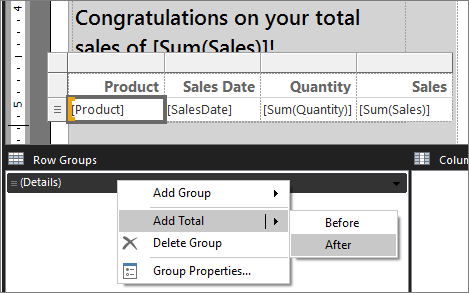
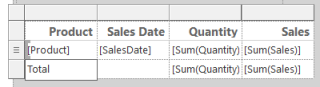
Use the New Table and Matrix Wizard to add a table to the free form report. After you complete the wizard, you manually add a row for totals.
Select Run to preview the report.
The report displays a table with sales details and totals.
You can save reports to a report server, SharePoint library, or your computer.
In this tutorial, save the report to a report server. If you don't have access to a report server, save the report to your computer.
The report is saved to the report server. The name of the report server that you're connected to appears in the status bar at the bottom of the window.
Add a line to separate the editorial and details areas of the report.
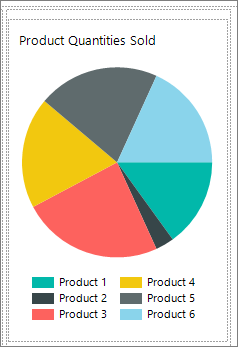
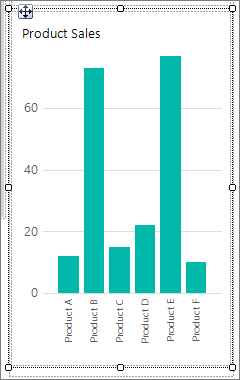
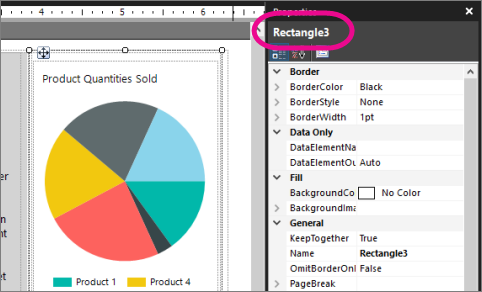
Rectangles help you control how the report renders. Place a pie and column chart inside a rectangle to ensure that the report renders the way you want.
You can use rectangles as containers for other items on a report page. Read more about rectangles as containers.
 the Name property in the Report Builder free form report." />
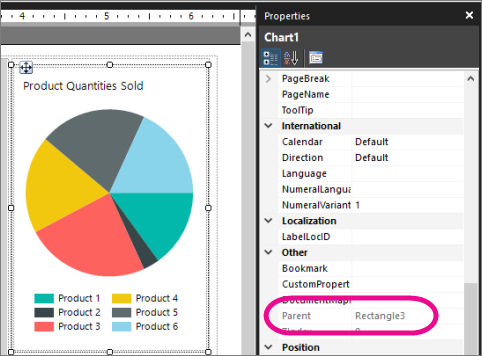
Note If the charts are not inside the rectangle, the rendered report does not display the charts together.
The report now displays summary sales data in pie and column charts.
You successfully completed the tutorial for how to create a free form report.
For more information about lists, see: